PwC has released it latest City of Opportunity report, focusing on 30 cities around the world.
While the South African report primarily focused on Cape Town and how it compares to other cities internationally, part of the study also focused on how it compared to other South Africa cities.
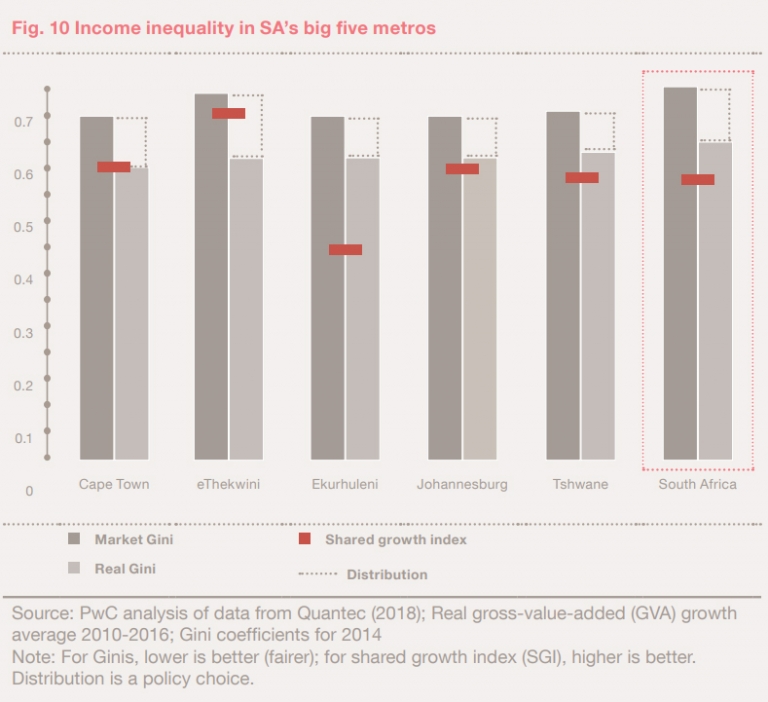
This includes a comparison of the five major metropolitans (Cape Town, eThekwini, Ekhuruleni, Johannesburg, and Tshwane), including their growth and inequality distribution.
“In South Africa, long the world’s most unequal country of any significant size, inequality is particularly entrenched, but the country’s metros have relatively strong redistributive powers that they can use to tackle this,” PwC said.
“Examples of this include providing free basic services and housing, direct grants and the use of their balance sheets to create social and economic infrastructure that benefits everyone.”
According to the report, the ‘Gini coefficient’ is the most popular way of showing income inequality. It is a number from 0 to 1 where 0 means that everyone earns exactly the same amount, and 1 means that one person receives all the income.
Using 2018 data provided by Quantec research, PwC looked at two separate Gini coefficients for South Africa’s big five cities.
“The ‘market Gini’ roughly describes how unequal income would be if the government didn’t provide any redistribution – no grants, no taxes,” said PwC.
“The ‘real Gini’ shows the score as it is after all interventions. By subtracting one from the other we can get a measure of how much each city manages to distribute,” it said.
The data shows that Cape Town has the lowest income inequality (real Gini) of any of the metros and along with eThekwini, it manages to achieve lower levels of real inequality than the country as a whole.
For the study, PwC also created a ‘Shared growth index’, which shows the cities that manage to redistribute the most while maintaining healthy economic growth. Again, Cape Town and eThekwini come out on top, this time with the order reversed.
“The Shared growth index is not meant to be indicative of success, and has no specific policy implications, but may provide food for thought,” PwC said.
“The index could be much improved by replacing gross-value-added (GVA) growth with better proxies such as foreign and local investment, business confidence and purchasing managers’ indexes, though these can be difficult to obtain at the city level.”